Chapter 12 - Process and Time Schedule
Part 2
Significance
You as a project manager, will need a toolbox to plan, control and monitor the implementation of the project. Taking technical and economic considerations into account, the project is set up
- within a specific timeframe (deadlines),
- with limited budget or resources and
- by focusing on the objectives.
You remember these three terms? Great! That's the magic triangle of time, cost and quality, which you already know from chapter five. The methods and processes of time scheduling are the key to the operational realisation of these objectives.
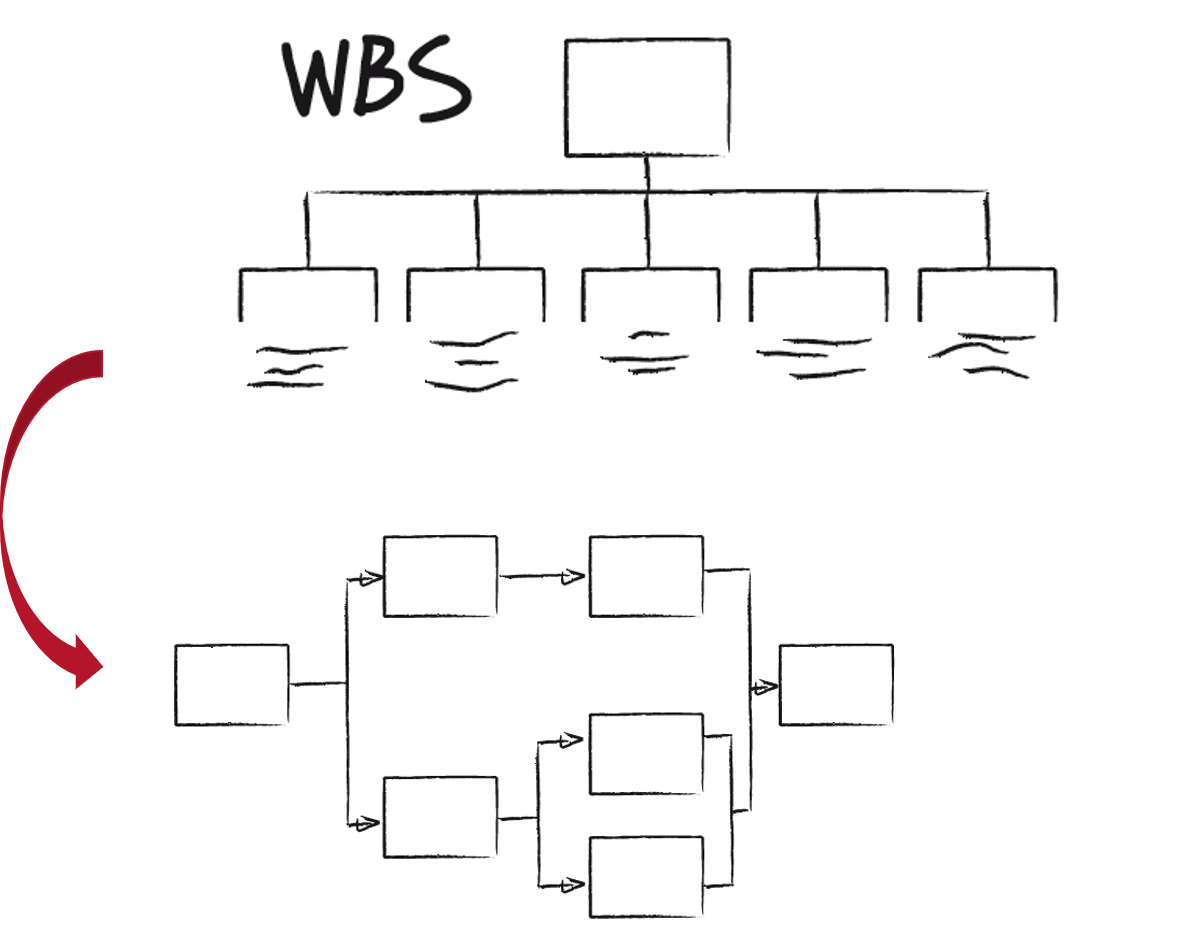
Process scheduling is a valuable aid to project planning in the early phase of the project and it enables you to consider alternative schedules and solutions taking deadlines, costs and resources into account. It supports the project planners and coordinators because it enables them to clarify the critical interfaces between individual parts of the project well in advance. It is based on project structuring. If necessary, the planner breaks down the work packages into even smaller units, which are called activities. This simplifies the process of estimating implementation times and resource requirements, thereby creating the basis for cost estimates.
When the process sequences have been established and times have been allocated to the tasks to be performed, the process schedule becomes the time schedule - and therefore the timetable for the project. Time scheduling delivers targets and, based on the cyclical acquisition of feedback data, provides an on-going record of the project's current status. This provides a platform where you and your team can monitor and manage deadlines, resources, costs and activities.
Network analysis plays a central role in time scheduling. With the assistance of the network diagram it is possible to map interdependencies between processes and deadlines and calculate the scope available for time scheduling and deadline management. If deviations from the planned project lifecycle are ascertained, your project team can use the network diagram to forecast possible consequences for subsequent work packages, sub-projects or project close-out, as well as test countermeasures. This acts as an early warning system so that the team can implement timely corrective measures.
Time scheduling steps
Time scheduling is a step-by-step approach to obtaining the above mentioned information.

Step 1: Specify work packages
- In order to plan, monitor and control the project lifecycle, it is generally necessary that you break down the individual work packages into smaller units (activities).
Step 2: Define processes and create a process schedule
- Work packages and/or activities are linked logically to one another (mostly this is initially done without taking resources into account).
- Information is transferred to a process schedule, which clearly defines
- the interdependencies that exist between the activities,
- the activities that can take place in sequence, concurrently or independently of one another and
- the necessary time lags between the individual activities.
- Process scheduling performs one of its main functions in this step: it ensures that your project team members specifically define the planned processes at an early stage in the project, which enables you to identify and clarify the interfaces in good time.
Step 3: Integrate the process schedule in the time schedule
- Project team members estimate realistic implementation times for the activities.
- You must ensure that the individual assessors do not include (hidden) float time for their own security.
- You alone have the authority to establish the total float for the project.
- If your team has estimated realistic implementation times for the work packages and activities, taking into account existing resources, the earliest and latest dates for each activity can be calculated and time-critical processes and extra time (float time) can be charted.
→ Concludes the (preliminary) transition from process schedule to time schedule
Step 4: Optimise the time schedule
- Deadlines that are initially calculated often show that your project team is unlikely to meet the desired or required project finish date.
→ Iterative process of schedule optimisation commences in conjunction with all accountable project personnel. - Planners can attempt to shorten the project lifecycle, for example
- by changing the process structure (e.g. by overlapping activities) or
- by reducing the implementation times (e.g. by increasing capacity)
- You can also simulate alternative scenarios and consider their effects on the project finish date or other objectives (e.g. costs or resource requirements).
Step 5: Approve the project schedule
- Individuals or units responsible for the project (e.g. customer, executive management, suppliers or you as the project manager) must approve the time schedule after its optimisation.
- Dates in the project schedule are therefore target dates and form the basis of time management.
- They are binding on all persons involved.
- Often, they are important elements of the contract with the project sponsor.
Step 6: Manage the schedule
- Time management is an aspect of time scheduling.
- Commences with recording deadlines and activities to monitor adherence to deadlines.
- Variance analyses enable the identification and analysis of deviations from the time schedule - especially delays or changes to the process structure.
- Based on the analysis results and if network analysis is consistently applied, it is possible to forecast the effects of deviations on specific areas of the project or the project close-out.
- As in the optimisation phase, you can consider alternative scenarios in order to identify suitable countermeasures.
- Time management delivers an early warning to the project manager to indicate when corrective measures are necessary.
Network diagram
The network diagram shows processes and activities and their interdependence is visualised in a graph or table. Activities can be work packages or even smaller units which are visualised in the network diagram according to their chronological position. Based on the network diagram, communication instruments can be worked out which will support the project in its further course.
Anyone who has ever seen a network diagram knows that it can look intimidating. But don't worry - follow the steps below and you'll see that even the network analysis is not witchcraft.
Developing a network diagram
Step 1: Place the WPs in sequence and link the individual WPs
- Which is the first work package?
- Which is the previous and which the subsequent work package?
- Which work packages run simultaneously?

Step 2: Has any WP been forgotten?
- If necessary, define the missing WPs.
- Include the missing WPs (also in the WBS!).
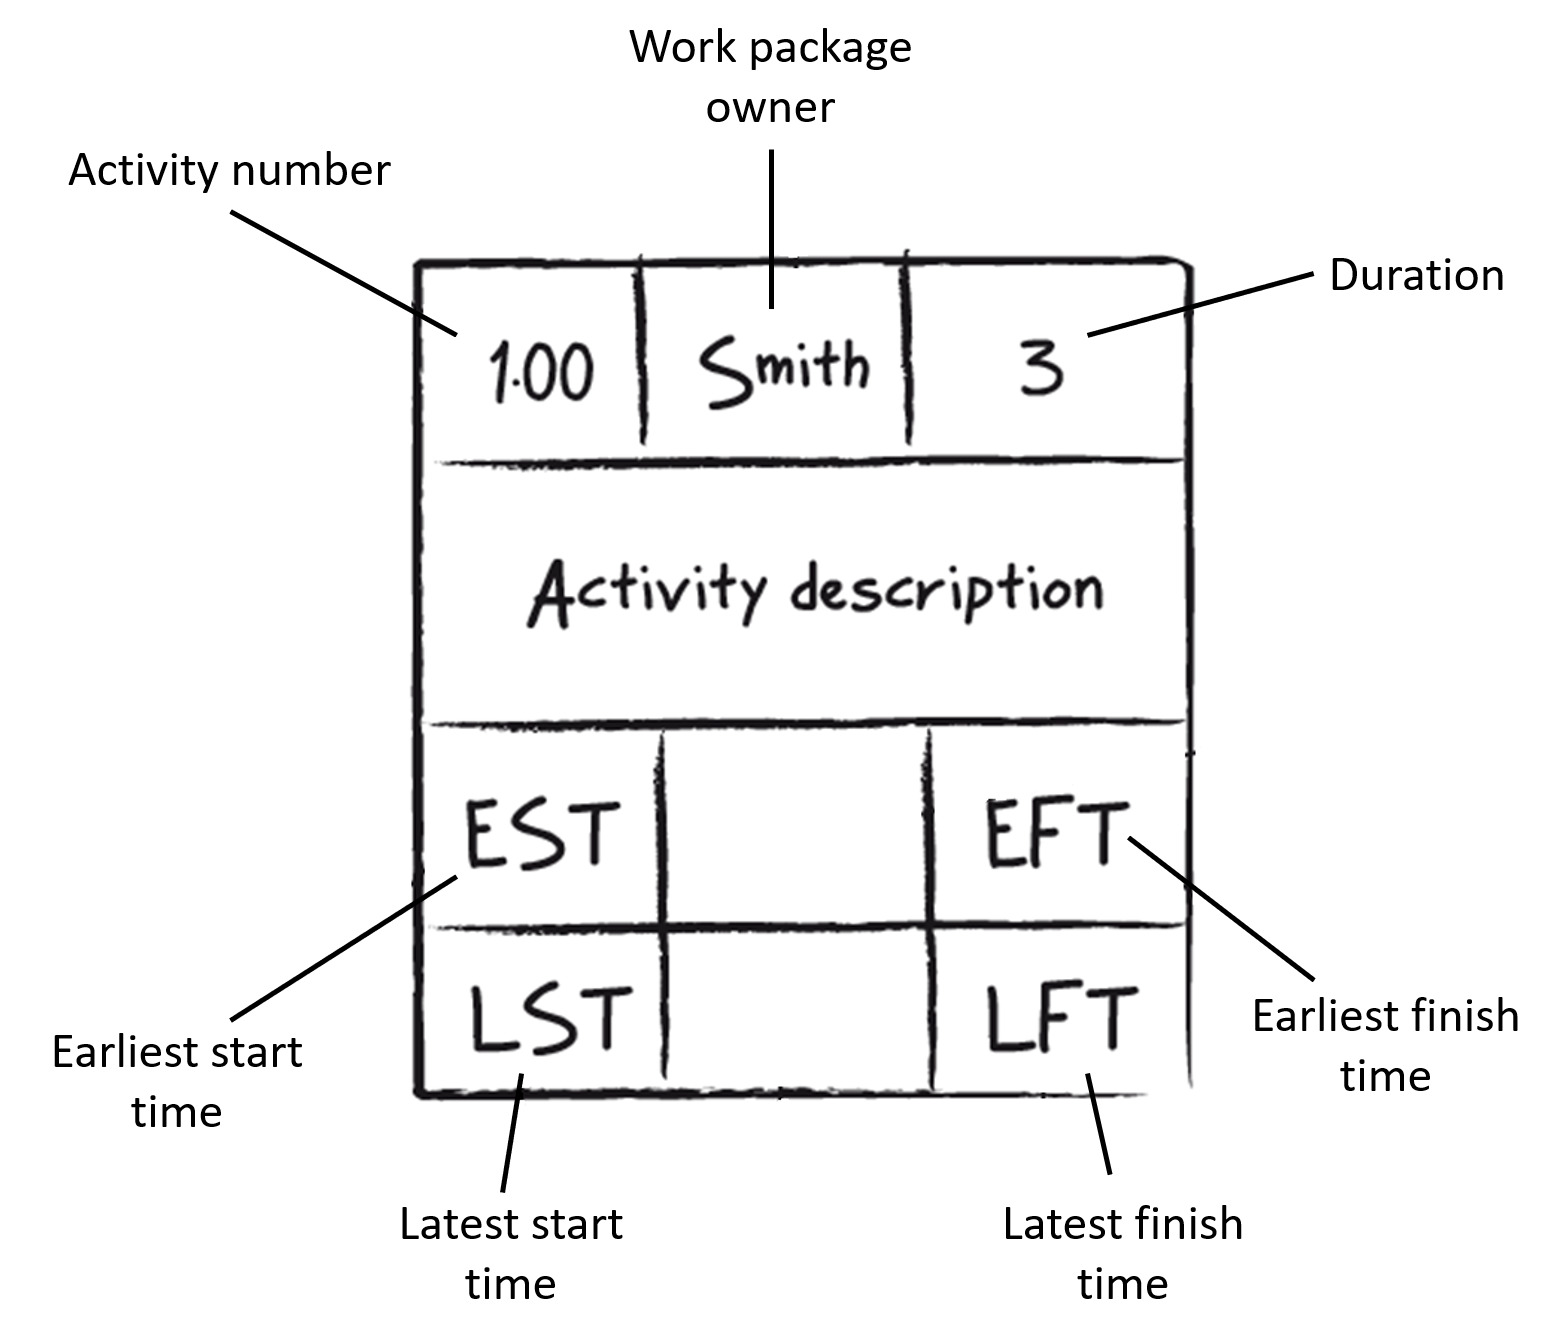
Step 3: Complete each activity with the necessary information which is already given
- Activity number (e.g. taken from the WBS)
- Person responsible/work package owner (responsibility for the performance of each activity is allocated to an individual, department or other unit)
- Duration of the activity (can be stated in time units such as days, weeks or months, sometimes hours or minutes are used); activities with a duration = 0 are so-called events, i.e. milestones
- Activity description (description of an activity states briefly what the activity comprises, more detailed description is given in WP description)
- Deadlines:
- Fixed earliest start time (EST) or latest start time (LST) can be specified for every activity in the network diagram
- Based on the EST and LST the earliest finish time (EFT) and the latest finish time (LFT) can be calculated

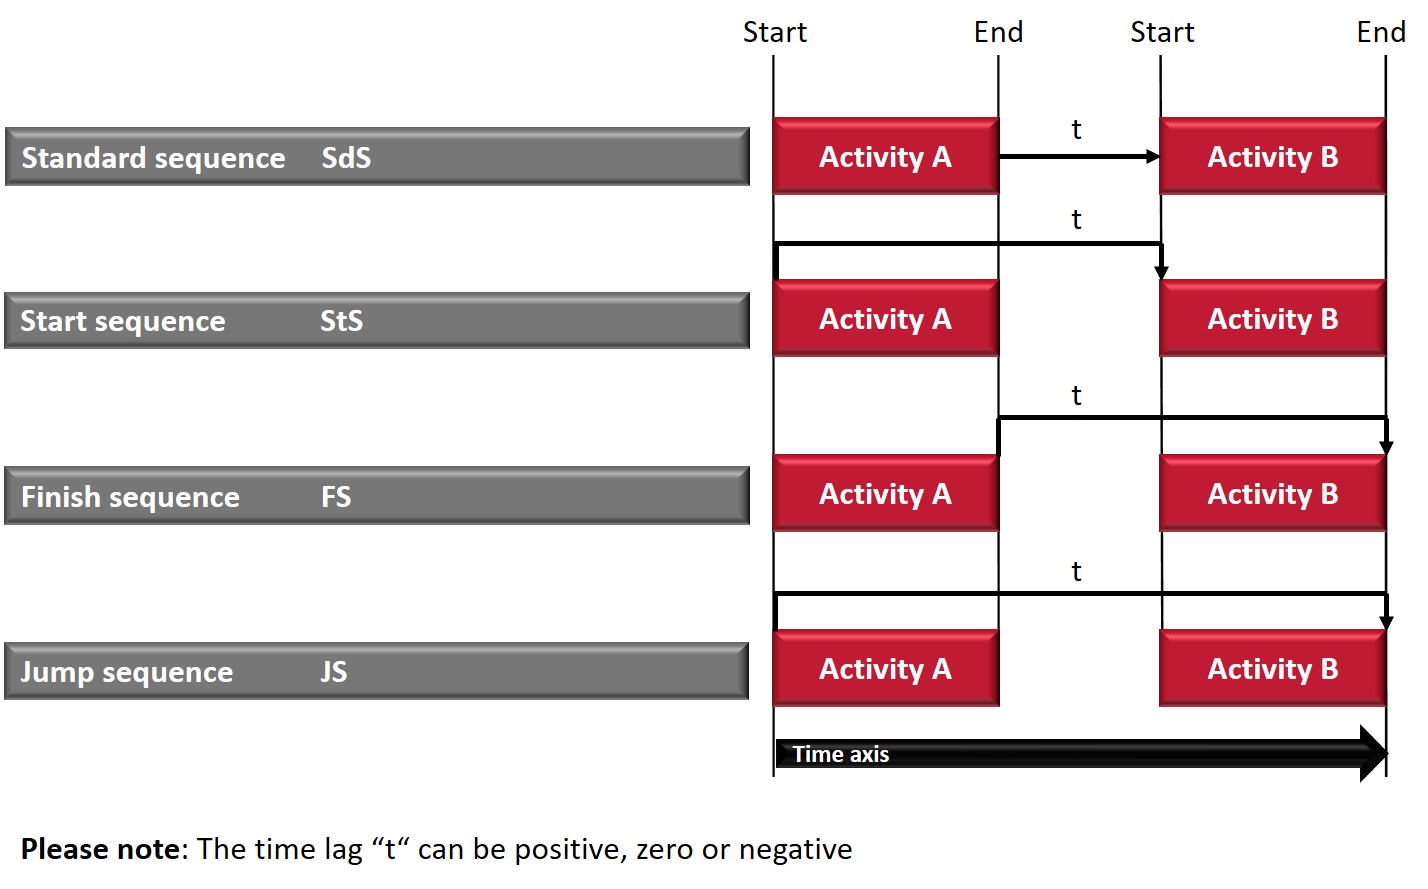
Step 4: What do precedence relationships look like in your network diagram?
The precedence relationships determine the logical sequence in which the project team realises the individual activities. There exist four different options.

Step 5: Make forward and backward pass calculation
- Forward pass calculation: Calculation of the earliest points in time or deadlines for all activities in the project network diagram
- Backward pass calculation: Determination of the latest reference dates for all activities in the network diagram
- Forward and backward pass calculations are prerequisites for the definition of the critical path and reserve (= float).
Step 6: Calculate floats and determine the critical path
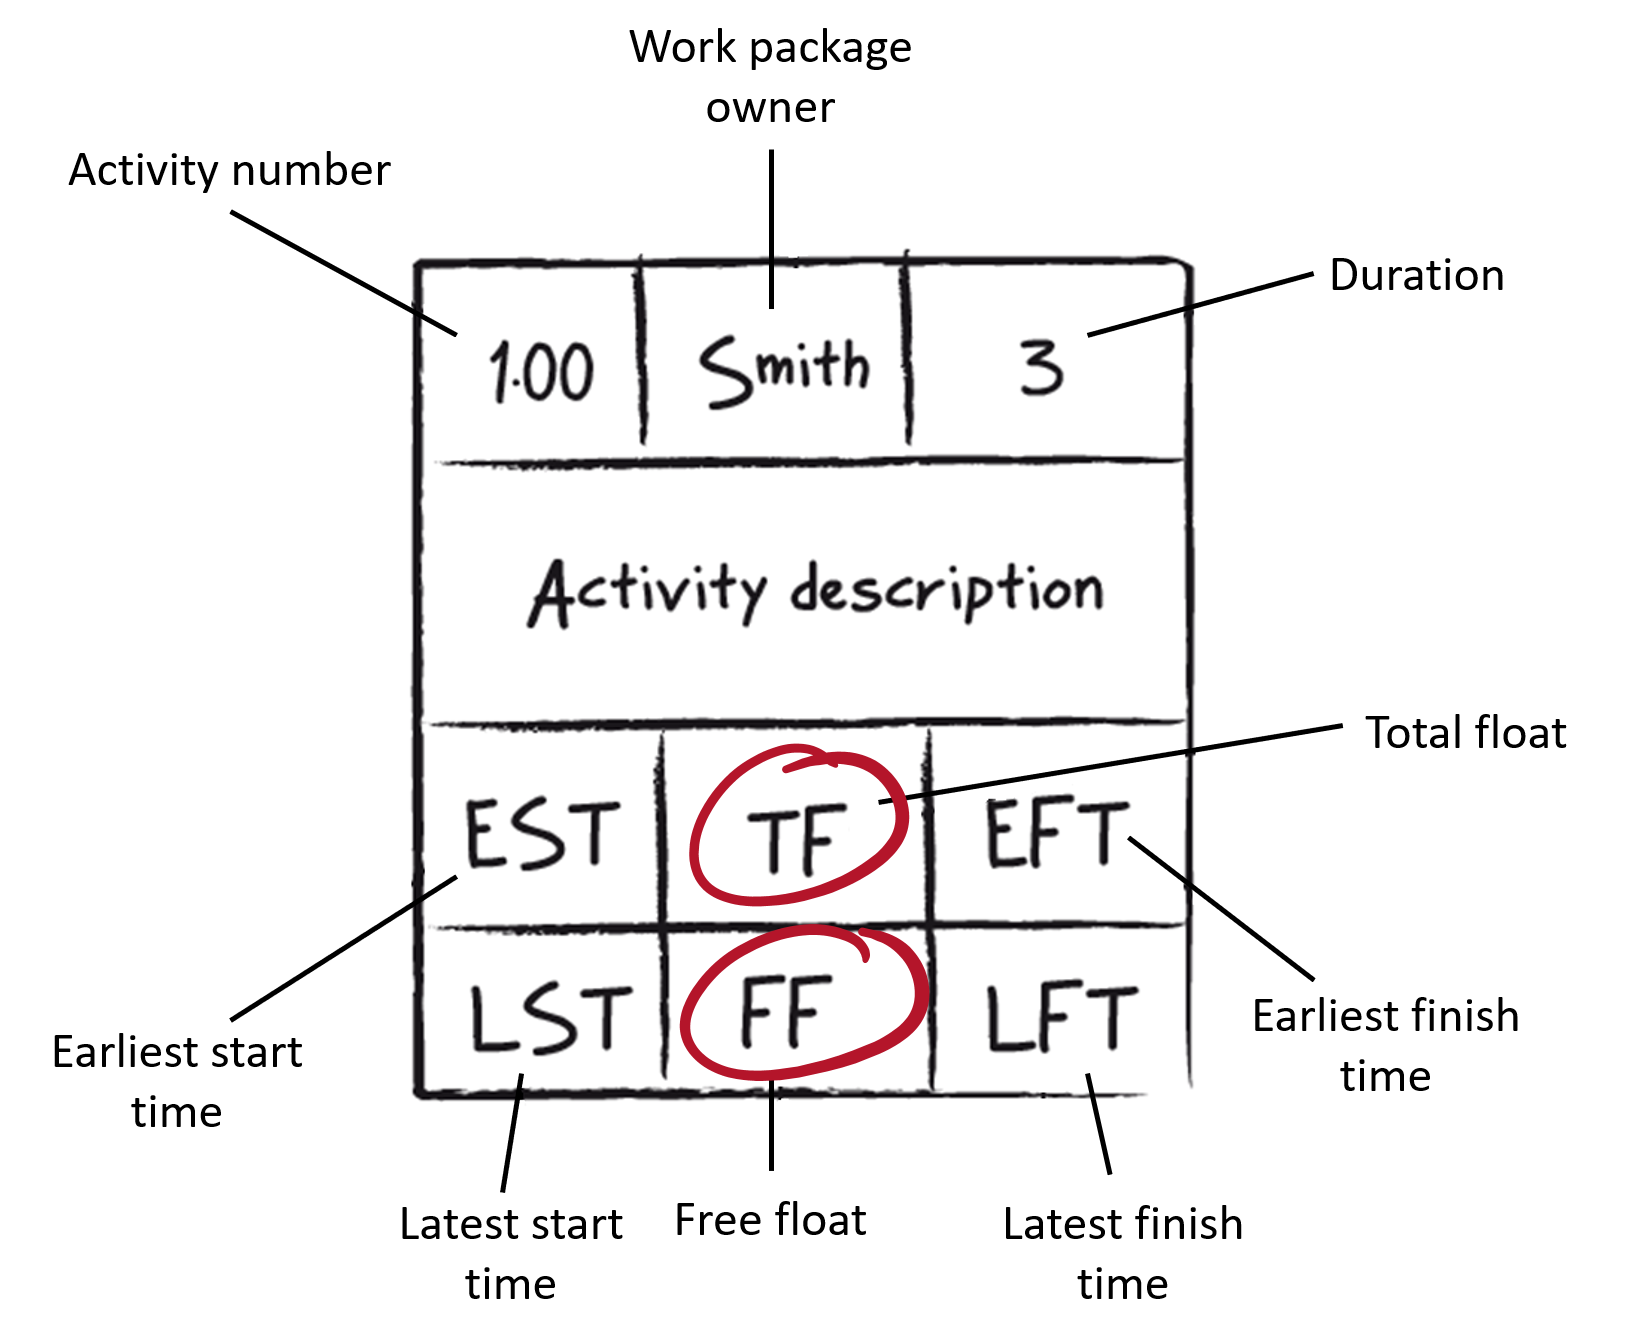
Also floats need to be fixed in the activity sheet. There exist two types of floats which need to be calculated first.
Please Note: AC means activity and SA stands for subsequent activity
- Total float (TF): The time between the earliest and latest position of an event or activity (predecessor activity in earliest position and successor activity in latest position)
TF = LSTAC - ESTAC = LFTAC - EFTAC - Free float (FF): The time by which a predecessor activity can be delayed from its latest position without altering the latest position of other events or activities
FF = ESTSA - EFTAC

- Critical path: Contains all activities for which the earliest and latest start and finish times agree, i.e. if there are no floats and this path takes the longest to be finished. If they shift on the time axis, the project finish date changes - in case such a shift appears, the following measures should be taken:
- You should demand more staff.
- Staff should work overtime.
- Supervisors and/ or customers should be involved.
Step 7: Identify any problems and resolve them
Adapt resources or objectives at deadline and/or quality level.
Advantages of a network diagram
The usage of a network diagram
- forces a systematic consideration of the project context,
- allows reliable scheduling of activities,
- shows where time is available, where time is short and where acceleration measures are necessary,
- is a flexible information tool that ensures the exchange of data between project and specialist management as well as supervisors,
- enables the control of the project process and the monitoring of the project schedule.
How the story ends…
Dr. Rogers says he'll bring along some tools and methods that will help them solving the problem if they aren't able to agree at the next meeting. Chris Feldmann and the team think that is a good idea.
Then, Chris Feldmann makes another suggestion about project work in general. "Our organisation has a project management software package for quite a while now", he says. "In our work package definitions, we've described the work package activities in detail. I suggest that we enter all the activities in each work package in the software tool. Then we can see exactly how far the project has progressed and which work packages are causing problems." Dr. Rogers thinks this is a good idea, but he decides to discuss it with his colleagues in the PM office first because they already have some experience of working with the project software tool.